Easy to administer. The 60-minute assessment predominantly tests vocabulary skills, mathematical skills and logical patterns.
Easy to administer. The 60-minute assessment predominantly tests vocabulary skills, mathematical skills and logical patterns.

The baseline is a test of developed abilities in vocabulary, mathematics and patterns.
An overall BASE11 score is the weighted combination of these three developed abilities and it is this overall BASE11 score that is used as the predictor to the end of Year 11 curriculum achievements (e.g. NCEA).
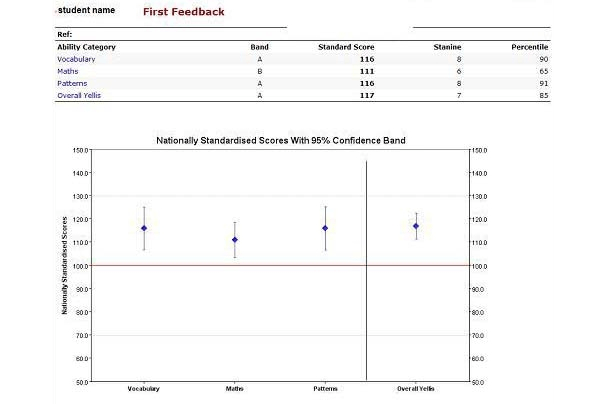
Graphs and tables are provided of each pupil, showing standardised scores relative to the BASE11 average of 100. Standardisation is done each year using the BASE11 cohort group. Scores above 130 are significantly high and scores below 70 are significantly low.
Each pupil is positioned within a quartile band for BASE11, with the 'A' band representing the top 25% of ranked scores and the 'D' band representing the bottom 25% of ranked scores.
What to look for: Consistency across all four developed abilities or else significant differences indicated by error bars that do not overlap.

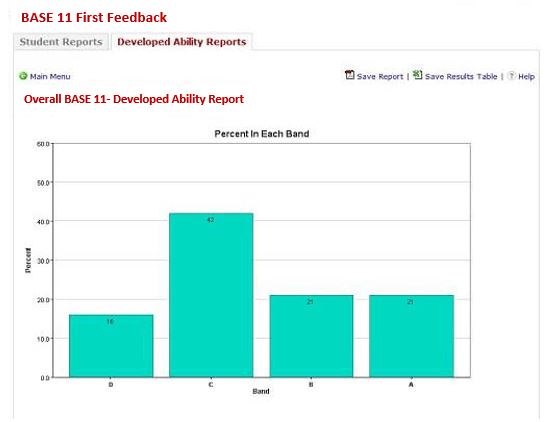
The quartile graphs indicate to a school what their intake is like, compared to the entire BASE11 cohort that year. Quartile graphs show the percent of a school's BASE11 scores within each quartile band. Quartile graphs are produced for each developed ability category: Vocabulary, mathematics and patterns, as well as a quartile graph for the overall BASE11.
All raw scores are ranked and divided into quartiles (4 sections), with the "A" band containing the top 25% of the pupils who sat the BASE9 baseline test and the "D" band containing the lowest 25%.

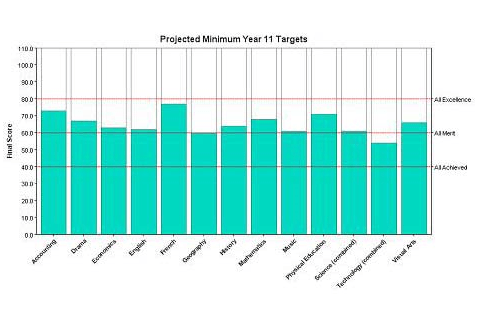
The shaded bar for each subject indicates the NCEA achievement of similar Year 11 pupils the previous year.
Actual values are approximate and the important focus should be on whether the pupil is expected to pass all credits in a subject with achievement, merit or excellence, or what proportion of their subject should be passed with each of these grades.
Since pupils currently register for an average of 20 credits per subject, the three horizontal lines are set at this value, but they can be moved. Calculation of targets are found by putting a pupil's BASE9 score into the previous year's regression lines for each subject.
In the above example, the pupil is expected to gain mainly excellence in all 20 credits in French. In geography, the same pupil is expected to achieve all 20 credits with Merit.
By clicking "Accept All Cookies", you agree to the storing of cookies on your device to enhance site navigation, analyse site usage, and assist in our marketing efforts.
0800 827 748 (within NZ)
+64 3 369 3999
Ext: 92111 (from a campus landline)
Direct dial: 0800 823 637
University of Canterbury | A Fair Trade University
