Tables and figures
The examples on this page are taken from data sources such A.C. Nielsen, Passport GMID and Statistics New Zealand as well as from books, journal articles and webpages on websites.
- See Tables and Figures (APA Style website) and Chapter 7 in the APA Manual for more detailed explanations and also sample tables and figures.
Definitions
- Tables refer to numerical values or text arranged in columns and rows.
- Figures are charts, drawings, graphs, flow charts, maps, photographs or any other illustration that is not a table.
General rules
- All tables and figures should be numbered (Table 1, Table 2, Figure 1, Figure 2, etc.) in bold font. The numbering is the order they are called out (referred to) in the text.
- Each table and figure should have an brief but descriptive title, in italics and capitalised in Title Case.
- All tables and figures should be called out in the text of the paper.
- UC Library database licence agreements allow students to use images in assignments. Statistics NZ also allows this. State copyright and also write: Reprinted with permission (see below).
- For Creative Commons licences, use the specified abbreviation (e.g. CC BY-NC, CC BY 4.0).
- If you reprint or adapt a table or figure from another source, you must have an entry in the reference list for the work in addition to the attribution in the table or figure note.
- Thesis writers will usually need to obtain permission to reproduce or adapt a table or figure from another source – see this Copyright page.
Table 1
Sales of Vitamins/Mineral and Herbal Supplements

Note. From Sales of Vitamins/Minerals & Herbal Supplements in New Zealand, 11 September 2010–11 September 2011, Nielsen Company, 2011 (https://answers.nielsen.com/). Copyright 2011 by the Nielsen Company. Reprinted with permission.
Callout in text
As shown in Table 1, vitamins, minerals and herbal supplements sales ...
Reference list
Nielsen Company. (2011). Sales of vitamins/minerals & herbal supplements in New Zealand, 11 September 2010–11 September 2011. https://answers.nielsen.com/
Figure 1
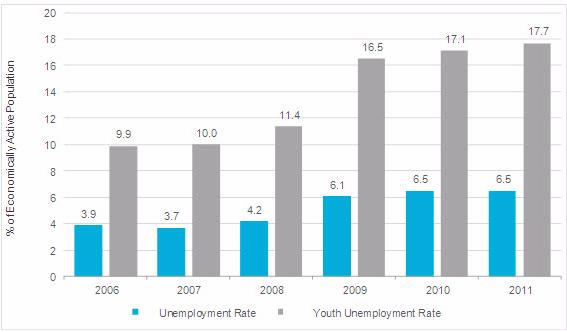
Youth Unemployment Rate vs. Total Unemployment Rate, 2006–2011

Note. Youth unemployment rate refers to the unemployed population aged 15–24 years old. Adapted from Economies and Consumers Annual Data: Youth Unemployment Rate in all Countries, Euromonitor International, 2019 (http://www.portal.euromonitor.com/). Copyright 2019 by Euromonitor International. Reprinted with permission.
Callout in text
As Figure 1 shows, youth unemployment rate has risen from 9.9% to 17.7% ...
Reference list
Euromonitor International. (2019). Economies and consumers annual data: Youth unemployment rate in all countries. http://www.portal.euromonitor.com/
Reference list
Euromonitor International. (2019). Sales of apparel by category, % volume growth 2006–2011. In Apparel in China industry overview. http://www.portal.euromonitor.com
In-text citation
... sales of apparel (Euromonitor International, 2019).
If you compile your own table or figure from data retrieved from another source (e.g. Stats NZ), write ‘Adapted from’ in the table notes.
Callout in text
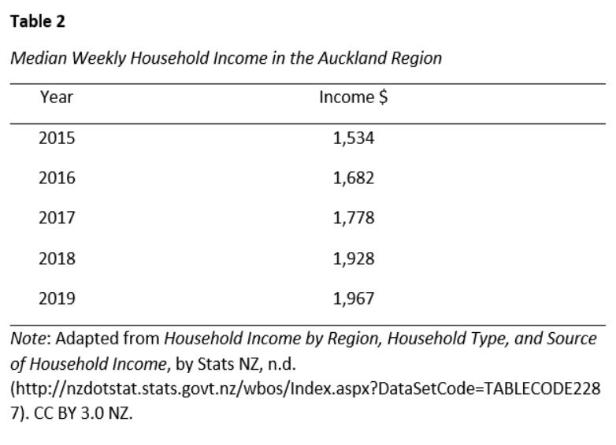
... the median weekly household income in Auckland (see Table 2).
Reference list
Stats NZ. (n.d.). Household income by region, household type, and source of household income. Retrieved October 31, 2019, from http://nzdotstat.stats.govt.nz/wbos/Index.aspx?DataSetCode=TABLECODE2287
Note
- Include a retrieval date when contents are designed to change over time and earlier versions of the work are not archived
- If you create a table or figure from more than one source, list all the sources in your note and include them all in your reference list. If you have created an original table or figure from your own data, no copyright statement is required.
Table or figure from a journal article
Note. From “Best Management Practices by Age,” by D. Adams and B. Matthies, 2018, Journal of Management, 14(3), p. 62 (https://doi.org/10.1999/abc0000055). Copyright 2018 by the New Zealand Management Society.
Reference list entry
Adams, D., & Matthies, B. (2018). Best management practices by age. Journal of Management, 14(3), 60–72. https://doi.org/10.1999/abc0000055
Table or figure from a book
Note. From Management 101 (p. 11), by M. Adams, 2009, Cafe College Press. Copyright 2009 by Cafe College Press.
Reference list entry
Adams, M. (2009). Management 101. Cafe College Press.
Table or figure from an online newspaper article
Note. From “Twelve Things You Need to Know About Driverless Cars,” by J. Silver, January 15, 2017, The Observer (https://www.theguardian.com/technology/2017/jan/15/driverless-cars-12-things-you-need-to-know). Copyright 2018 Guardian News and Media Limited or its affiliated companies.
Reference list entry
Silver, J. (2017, January 15). Twelve things you need to know about driverless cars. The Observer. https://www.theguardian.com/technology/2017/jan/15/driverless-cars-12-things-you-need-to-know
Table or figure from a webpage on a website
Note. From A Butterfly Story in a Primary Classroom, by Science Learning Hub–Pokapū Akoranga Pūtaiao, February 9, 2022 (https://www.sciencelearn.org.nz/resources/2358-a-butterfly-story-in-a-primary-classroom). CC BY-SA 3.0.
Reference list entry
Science Learning Hub–Pokapū Akoranga Pūtaiao. (2022, February 9). A butterfly story in a primary classroom. https://www.sciencelearn.org.nz/resources/2358-a-butterfly-story-in-a-primary-classroom